Creating a new chart
The template I have provided for download at the beginning of the article covers some commodities.
If you wish to add new ones, here’s how to.
1) Press the Create New Chart Window button in the main application hotbar.
~1~
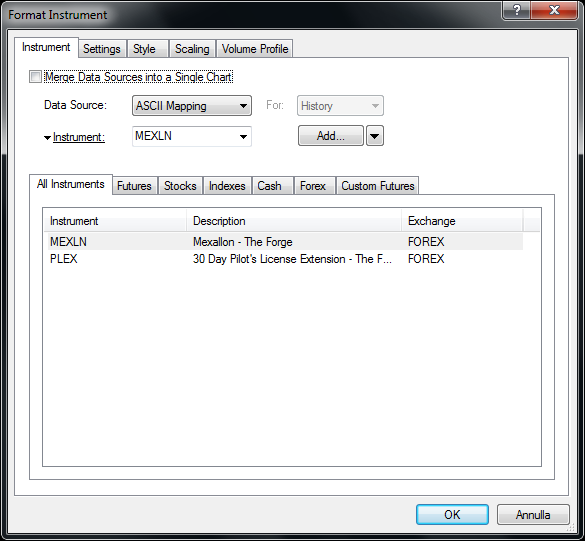
2) Unsurprisingly, a new popup window will appear. Here we have to tell the platform which commodity we want to show on the graph. The software has thousands of advanced options including multi-security charts and so on but we’ll stick to the bare bones. Therefore just click on the commodity we want to show (MEXLN in the example) as follows:
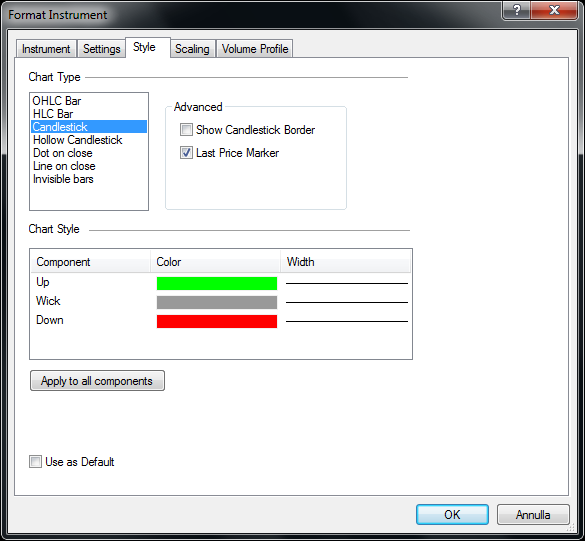
3) Press the “Style” tab and set up the various values and colors till you get this configuration:
If you also press the “Use as default” checkbox at the bottom of the window, you will not have to repeat this style setup again for the next commodities.
You might also want to check the “Scaling” tab out. By default prices come with four decimal digits. You may adjust them to two or zero by checking the “No. of digits after decimal” option and indicating a value.
Press OK and the new graph will show. You’ll notice that the graph is probably stretched and shows grids.
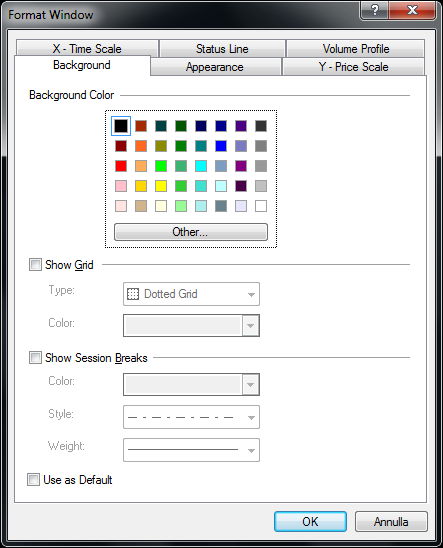
4) To make the graph clean, right click on an empty area on it and select “Format Window…”. A pop up window will show, set it up to look as follows:
Once again, if you select the “Use as Default” checkbox at the bottom before pressing OK, this customization will be automatically repeated on all the new charts you will create without you having to repeat the setup again.
We are done!


Comments