Intended audience
- Beginner EvE traders who opened an EvE market chart for the first time and wondered what is it about and what are all those “lines”.
- Experienced EvE traders who want to push their experience a bit farter. They will be covered after the basics sections.
- EvE players who cannot / don’t wish to commit themselves to learning advanced, RL trading alike methods like Experiment #01: RL finance analysis applied to EvE.
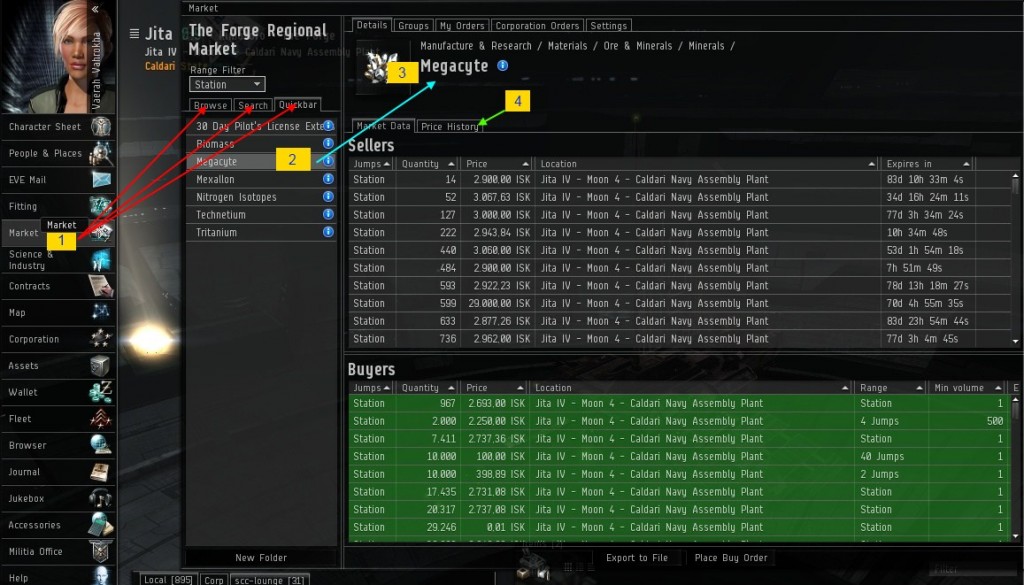
a) Open the following screenshot on another browser window / tab. You may zoom in by clicking on the picture.

b) Click on the Market button on your buttons bar (below your character’s portrait), marked as “1” on the screen shot.
c) Search / browse / use quickbar for an item you want to check out. In this tutorial, we will look at Megacyte. It’s marked as “2” on the screen shot.
d) You should see the desired item’s name at the top (marked as “3”) and below it, the list of current sell and buy orders.
Sorting the orders, placing buy / sell orders are beyond the scope of this article, there are other tutorials which extensively cover this “Market Data” tab.
e) You are in the Market Data. In order to see the graph, you have to click the “Price History” tab, marked as “4” on the screen shot.
What’s a market graph?
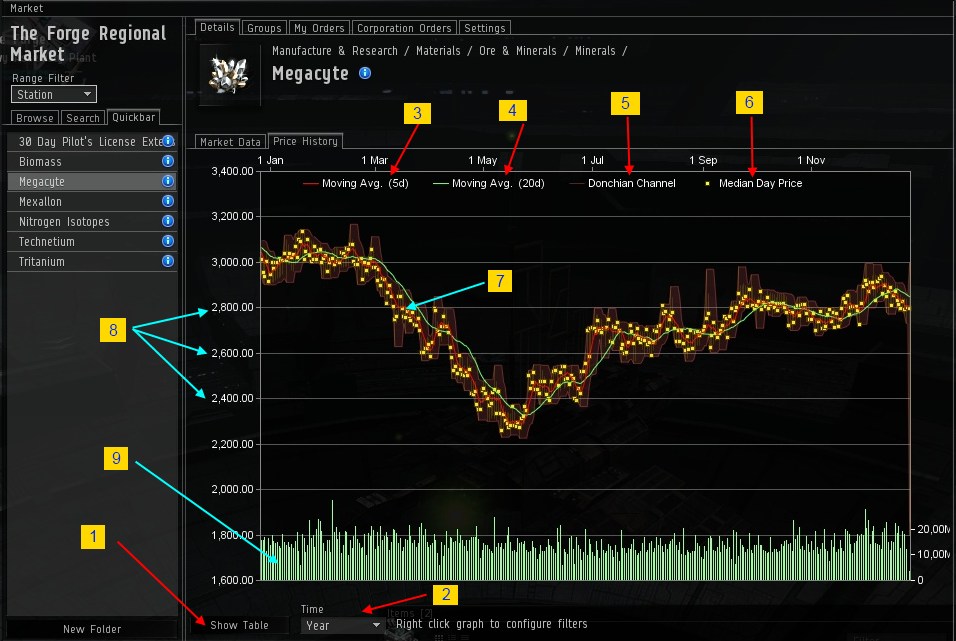
It’s a visual representation of a market prices history.
Please open the following screenshot on another browser window / tab. I will refer to this graph as “Window 1”.
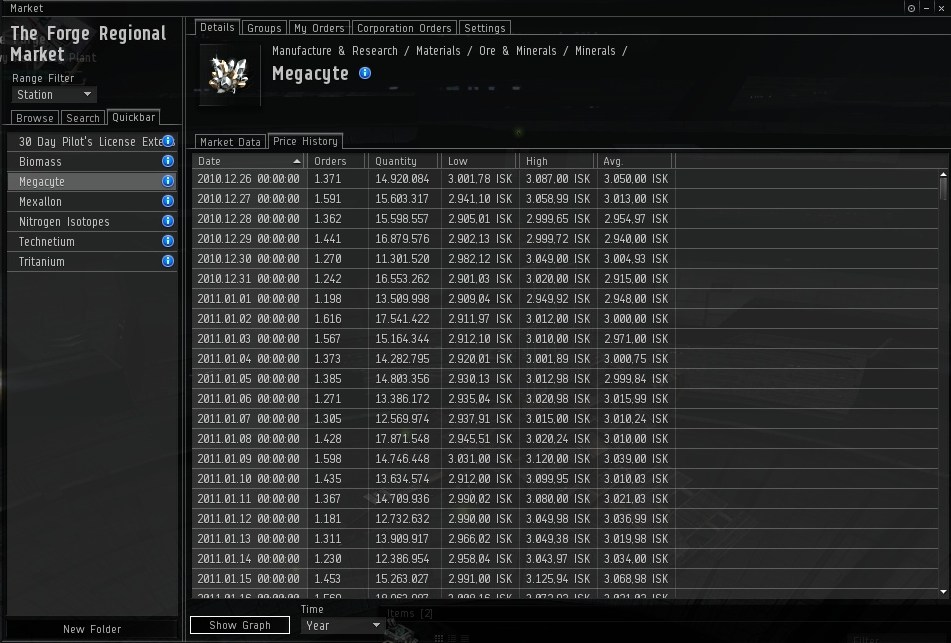
You may look at (and switch to / from) “dry numbers” by actually clicking on the “Show Table” button, marked as “1”. The table looks like this second screenshot. I will refer to this graph as “Window 2”.
The table and the graph contain the same information about the only market protagonist: price. Nothing else matters.
Both the table and the graph show the price for that market in the last selected period of time. To select which period to look at, click on the “Time” selector at the bottom of the window, marked as “2”. It’s available on both Window 1 and 2.
Each recorded trading session is 1 day long (see the first column in the table) and comes with the following information: Date of the session (time is always 00:00:00), number of orders executed, number of units traded, lowest price for that session, highest price for that session and “sanitized” average (CCP employs algorythms to clean stray / purposedly deceiving orders. They are applied on next day, so it’s possible to see weird values for the current session).
Let’s get back to the graph (press “Show Graph” if you are in the table view / Window 2).


Comments