Some markets properties
Markets are pushed by demand and offer and are driven by contrasting greed and fear.
Healthy markets always oscillate in an unpredictable zig zag motion. Markets are fractally self-similar, you may zoom in or zoom out and find the same kind of zig zag motions containing or being contained by other zig zags.
Price perpetually moves in an highly optimized manner, filling all the past and present available price levels and gaps (akin to how plants optimize light exposure by disposing their leaves and petals by Fibonacci sequences). This perennial motion is called “price discovery”.
Markets appear to move randomly (“random walk, brownian motion”) but that’s only true in the smallest time frames where micro-transactions between individuals form “noise”. The longer time frames are driven by demand and supply balance variations.
You may profit by knowing why / how / when demand and supply are changing (performing a so called fundamental analysis, i.e. reading patch notes about buffs or nerfs) or by reading the charts and understanding how and when demand and supply are changing (technical analysis). Fundamental analysis is potentially the most profitable kind of strategy and gives a time advantage in trading but requires a robust knowledge of many, often intermixing underlying factors including politics and rumors.
From about 70% to 80% of the time, markets find themselves in a state of quasi-stable equilibrium where prices don’t change much. Price stays confined and oscillates within a relatively small range. This price motion is called “range market” or RM.
When this balance is broken by any important enough event, price adjusts to the new equilibrium, often with some lag, overshooting the target and oscillating around it. The speed and smoothness of this process depend on many factors including available liquidity, market speed, big positions being closed speculations, manipulations. This price motion is called “trending market” or trending.
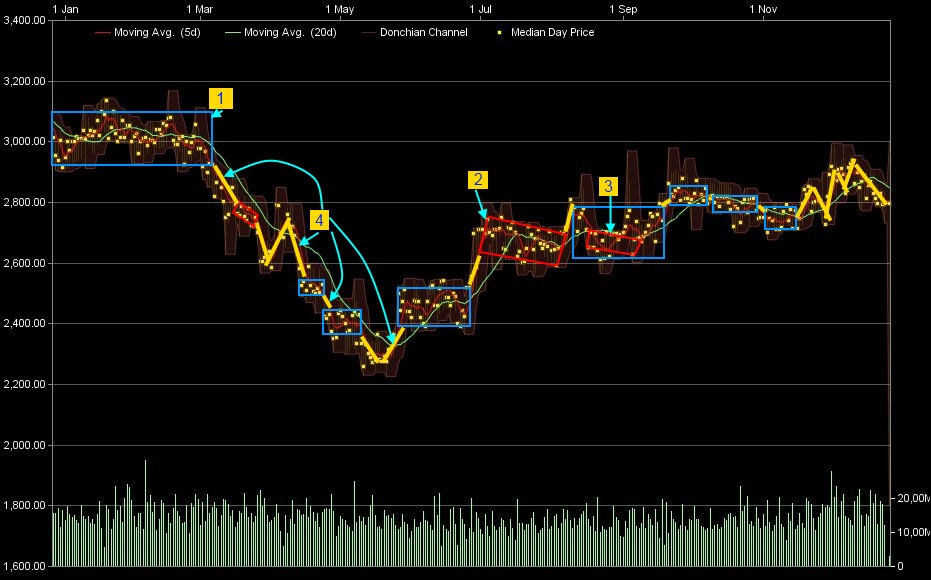
The following graph shows some RM and trends.
The blue rectangles enclose RMs (ranging market zones) and are marked as “1” on the chart. As you may see, there are many (I did not even mark all of them). They are delimited by an horizontal, plain rectangle and are also known as “static RMs” because of that.
RMs can also form in a diagonal direction. They are rarer and are called “dynamic RMs”. They are the red rotated rectangles marked as “2”.
Since markets are fractally self-similar, features like RMs may enclose other RMs. An example of dynamic RM inside a longer term static RM has been marked as “3” on the chart.
The graph also shows some trends, the yellow thick lines marked as “4”. It’s easy to see how a market tends to range for most of the time and trends act as connectors between the various ranging zones.

Comments