Identifying range markets
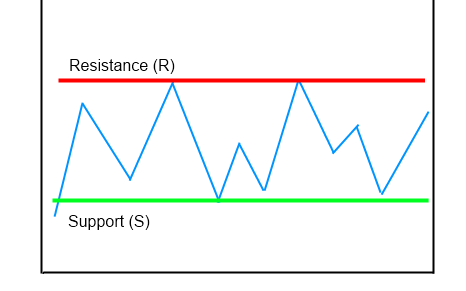
Range markets exist when there is no clearly identified direction for the swings / zig zags. There’s no “ladder” shape in the swings, they randomly go up and down often hitting an invisible ceiling and bottom.
The following picture shows a typical RM:
~1~
It’s evident how the highs and lows sequence is completely irregular and shows no real direction.
Despite the irregularity, it’s possible to notice a peculiarity: RMs seem to stay confined between a top and a bottom limits.
Drawing those imaginary limits on the above example would lead to the following picture:
Why does price tend to hit (and be stopped by) RMs tops and bottoms? The answer is very complex and it won’t be fully covered here. A simplified version will be given.
RMs are places where demand meets offer and traders place many orders around there. When price hits the top that the demand / offer equilibrium allow for, sellers orders (greatly aided by supply being stronger than demand) take the upper hand, sometimes with real “blocking orders” (big orders hard to fill). This behavior institutes what’s known as “resistance” (R), that is an imaginary line that repels price down, like a barrier. All the RMs, both static and dynamic have such resistance price level as their top.
The same happens for the opposite case, when price hits a RM floor. Buyers, greatly aided by demand being stronger than supply, take the upper hand, sometimes with massive blocking buy orders placed right below the floor. This forces the price to stay at or over an imaginary line called “support” (S).

Comments