Last but not least, there are four very important rules about the support and resistance price levels:
1) The more price hits them, the stronger they become. Traders confidence on these levels “holding” against price rises over time and they place more and more orders mutually reinforcing themselves and their beliefs.
2) The more factors converge into forming a support or resistance, the stronger it tends to get. If a support or resistance happen to coincide with an easily remembered round number (aka RN, i.e. 2900 ISK pu) or, even more, big round number (aka BRN, i.e. 3000 ISK pu), those price level lines hold stronger. Rarely, there are further, exotic convergences: an horizontal support that also coincides with the extension of a diagonal previous support, or a support sitting at a so called Fibonacci number. The more the factors involved in this so called “convergence” the stronger the price level holds.
3) Markets have a very strong memory. Once price explored a new support / resistance, that level will be reused later, sometimes after years. There are some old stocks that persistently hit levels they reached 30 years in the past. This memory effect is due to traders using graphs (self fulfilling prophecy) but also because that market demand / support equilibrium “resonates” at those levels by itself. In EvE this effect is reduced both because very few traders use graphs and markets liquidity is much lower than the real stocks markets, therefore patch and player induced variations may affect markets much more than they do in real markets. Each market has his own temper, some have strong memory others don’t.
4) When a breach of those levels occurs, it’s sudden and strong, like a dam bursting. And very curiously, when price gets back to them, they switch “role”. Supports that held price up, become resistances that will try avoid price getting back up and vice versa.
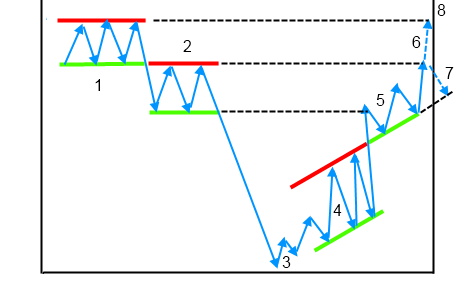
How the whole mechanism works is shown by the following picture:
~1~In the first section of the price graph, marked as “1”, there is a RM. The red line is the resistance level where sellers liquidity prevails, the green line is the support level where buyers liquidity prevails.
Something happens to the demand / offer equilibrium and price breaks thru the support. It falls to a lower level (next green support line below) that very often was already reached in the past due to the above mentioned memory effect. Then it moves up and will hit what was the previous support line and the roles inversion happens: the former green support line above now acts as resistance (thus it’s painted red now, marked as “2” on the chart).
Price forms another RM until something happes again and the market crashes down to the level marked as “3” on the graph.
This time price decides to trend up, as the climbing up zig zags show, until it seems to hit a diagonal, dynamic support line marked as “4” on the chart and bounces up and down forming a dynamic RM. Exactly as for the static (horizontal) RMs seen above, price may breach its RM bounds and then use the extension of the resistance as new support (marked as “5”).
Not incidentally, the first price zig zag close to “5” snaps exactly where in the past, at the same level, we had the support of that RM marked as “2”. The last zig zag all to the right also acts in a similar way (snaps to the same past RM’s resistance). The following picture shows dashed lines to visually aid seeing the connections:

Comments