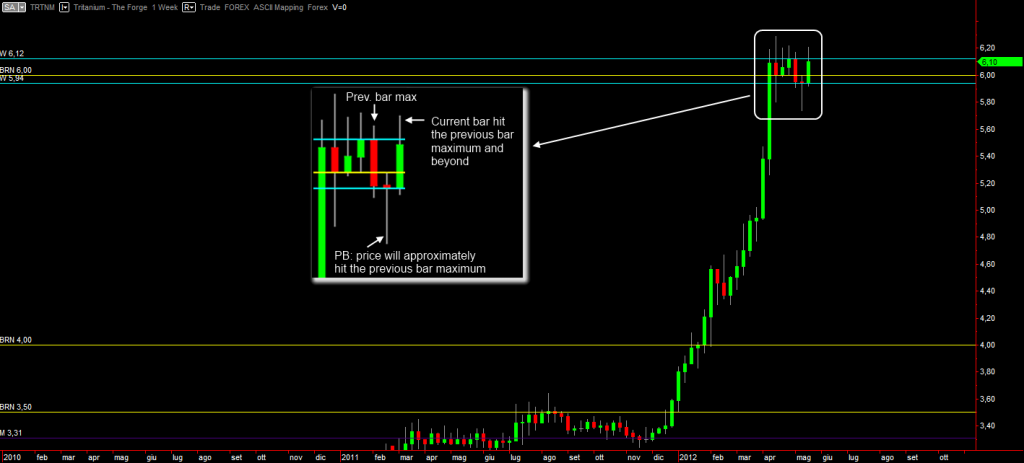
Price decided to form a range market. When almost at the top of it, I unloaded some little more, trying my best to split the stock in small chunks.
Price kept ranging and dipped a bit as traders were taking profit on release of the Escalation to Inferno patch. I waited for a bullish pattern, which came at the middle of May.
Here is a full update to the Tritanium graphs.
Monthly:
~1~
Now, there is a pattern rule that states: “a pin bar will drive the next bar price at least up to the high of the previous bar” (down to the low of the previous bar in case of bearish pin bars). While the current monthly bar is still being formed and thus very unreliable, the high of its previous bar is at about 6.3 ISK which is an element to consider for the money management.
Weekly:
A similar reasoning may be applied to the weekly graph. Price is ranging between the two weekly price levels acting as support and resistance. A pin bar formed below BRN 6 on May 13, 2012. Knowing the PB rule stated above, a trader could simply have lazily bought there off sell orders and sold at 6.20 2 days later and earned about a completely risk free 2% (net of broker fees). The graph shows a zoom in of the involved bars.

