- Exchanges: these are the physical or virtual locations where securities trades happen. Some securities are traded outside the exchanges, others are mediated over multiple local exchanges or dealers and don’t have a specific centralized exchange. Traders usually don’t directly deal with exchanges but through middlemen organizations called brokers who in turn provide their clients their best quotes for any given security (notice: their best quotes, not necessarily the best quotes). This is quite important, as some markets feature the so called “market maker” brokers who show their traders a price that is not the real underlying security price. In fact they don’t take a fixed fee but embed a variable fee inside the so called “bid – ask spread”. A very complete and in depth look at the market macro and micro structure is covered in one of the only two books about trading that are worth buying: Larry Harris’s Trading Exchanges: Market Microstructure for Practitioners.
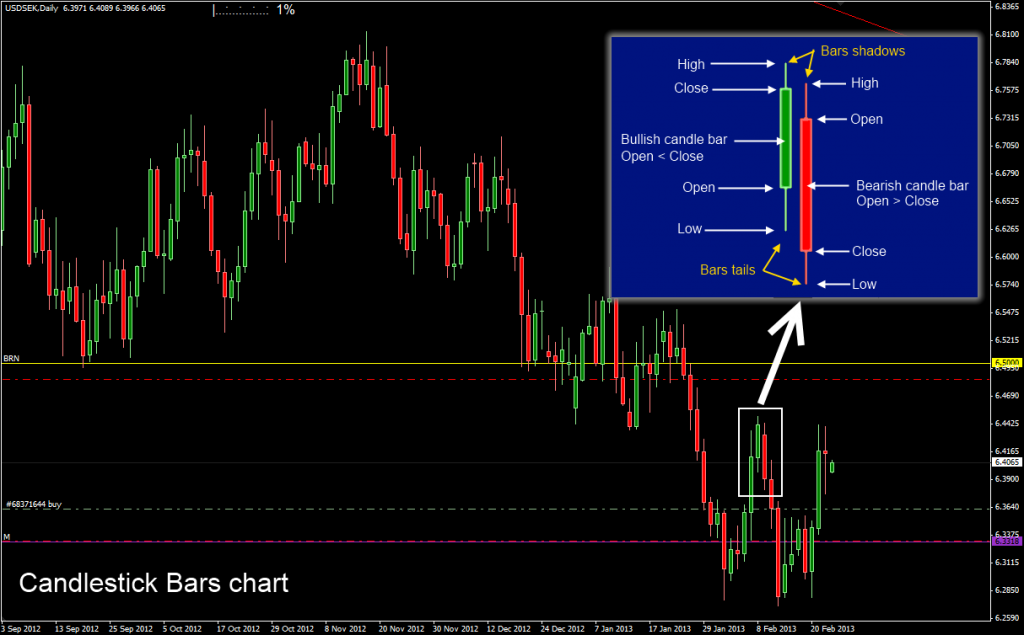
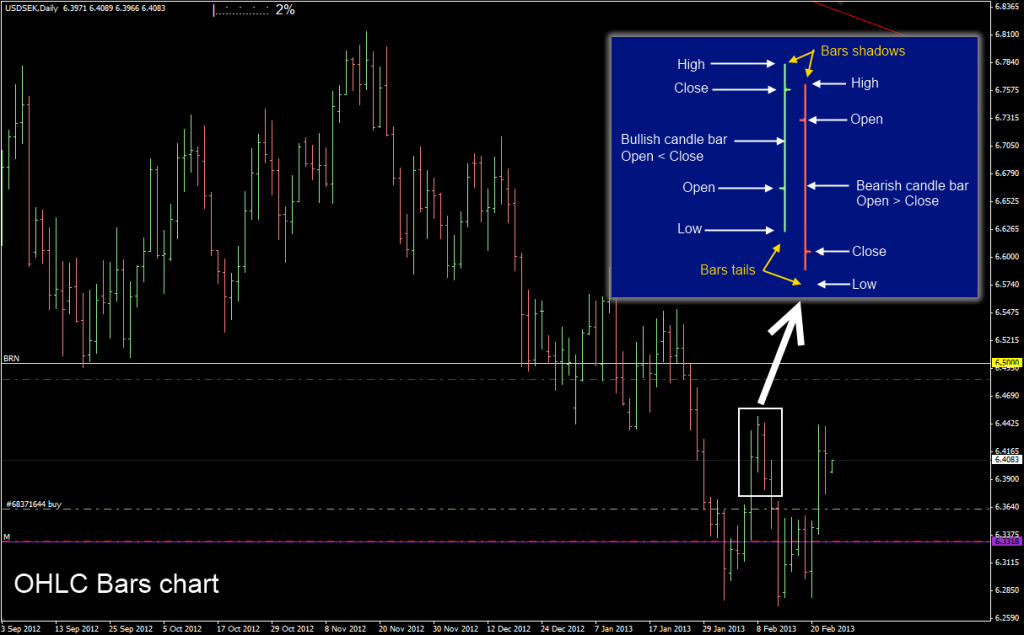
Exchanges also bring in the concept of trading sessions, which in turn bring in the concept of bars charts. Exchanges used to have (some still have) dedicated pits where traders would work during certain hours of the day. Each new day would make a new session, the exchange was open during those hours. Certain price quotes would be recorded: the price at the exchange open (not always), at the exchange close, along with the minimum and maximum price hit during the day. These values are so important that even today most traders use charts listing the recorded past Open, High, Low and Close (OHLC) prices for the past days, months and years. Such charts show particular bars that hold those values. There used to be HLC bars too (the close of a bar would be the open for the next) but they are rarely used any longer. These days another kind of bars has risen to standard: candlestick bars. Those resemble little candles, have “wicks” or “tails” or “shadows” and convey the same information of OHLC bars in a more eye friendly format. Candles representing trading sessions that opened at a lower price and closed at higher price are usually green colored and called “bullish candles”, those representing sessions that opened at an higher price and closed at a lower price are usually red colored and are called “bearish candles”.
Candlesticks bars chart example, the zoomed in portion shows the various bars components:
OHLC bars chart example, the zoomed in portion shows the various bars components:
Comments