Weekly chart
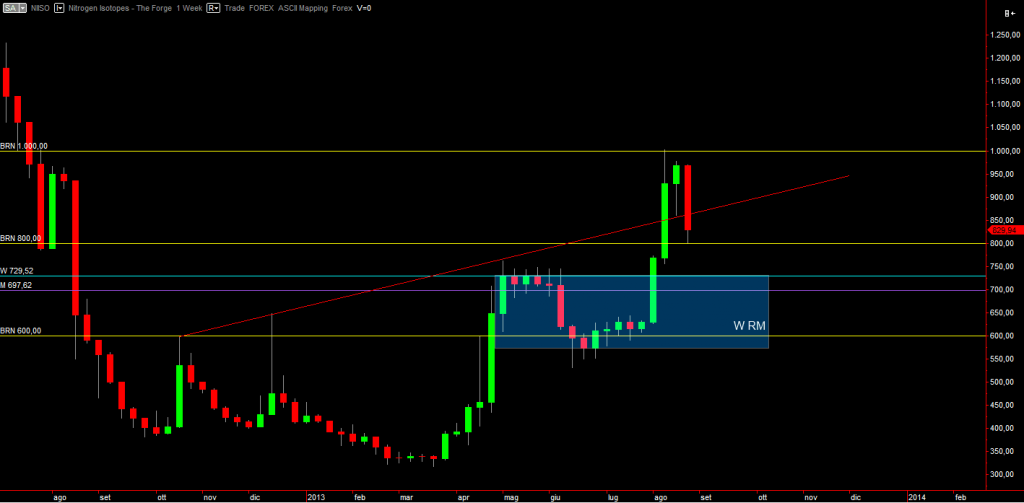
~1~The weekly chart shows some quite useful detail. First of all the trend line now shows (once again) that price tends to be quite precise in its motion. Trend lines are nothing more than a kind of level that forms in diagonal instead of being horizontal. However, those levels are harder to spot and thus are worse to trade than the horizontal ones.
A feature, a pattern that immediately pops out off the chart is the weekly range market (W RM, in blue). If you look at it, you will see why leter I gave my “mesa” reply in the EvE-mail above: it is the mesa. Price is talking, it has just to be heard.
Also, despite being completely unpredictable in general, price sticks to its own rules. One of them is: “if price comes back inside a RM, the RM’s old resistance will return being in force and so will the RM’s support. Price will re-enter a rectangular cage where a trader may use this rule to short sell at resistance with support as first target or to buy at support with resistance as first target.
Please notice how the monthly and weekly analyses don’t try guessing price’s immediate next moves but just to understand What Price is Doing, that is a “macro” overview, a context.
Daily chart
Where Price is Going (WPG)
The daily chart is actually the one where the swing trader attempts to see the finer details about the next price moves. Contrary to popular belief, getting an useful prediction it’s not a given, at all. A swing trader knows that price might graciously disclose its intentions at any time, but the only place where to put them in an human comprehensible context is at price levels. Only a price level affects the otherwise completely unpredictable price motion, in a way that statistical recurring price patterns analysis (called “Price Action Analysis”) may give a statistical edge about Where Price is Going (WPG) next (*). Therefore, be ready to check the daily chart every day, because we are only interested at trading a certain market when price hits one of its “chords”, a price level.
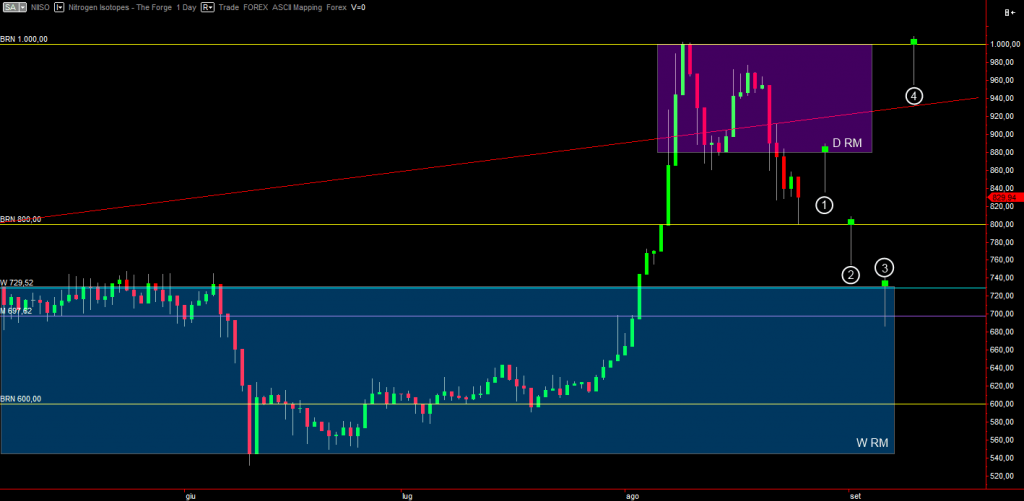
In this specific case, price at the date of the analysis was doing nothing “trade ready”:
(*) With great experience it’s possible to trade “free form” with no levels, as candle bars themselves each are tiny range market and their bodies represent tiny price levels delimiting those range markets. It requires a completely different money management; getting able to trade free form is an “end game goal”, not the regular day by day trader life.
Back at the date, I covered four useful cases, shown on the chart as white circled numbers. I only covered buy opportunities, both because we are in an overall uptrend and because we cannot short sell in EvE anyway.

