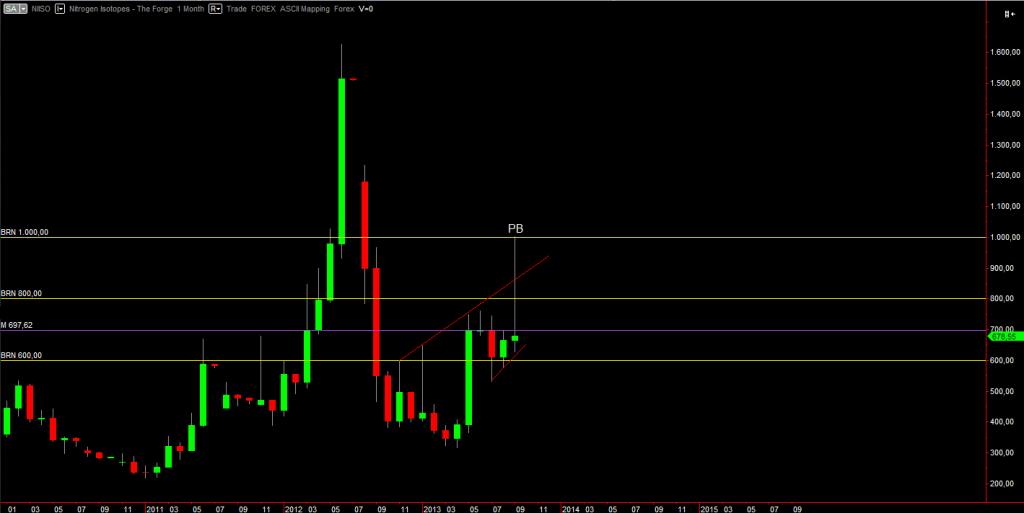
Nitrogen Isotopes market analysis
~1~This is the second part of the Nitrogen Isotopes market analysis – Pt 1.
I have waited till the end of the month before delivering the second part. This let the weekly and also the monthly bars to close, which is always a good thing because closed bars are the only significant ones to consider. Since they closed just yesterday, the information the market gives us is the freshest possible.
This analysis will cover more didactical concepts, and once again it’ll show how awesome are the “gears and levers” that drive the markets.
Monthly chart
What Price is Doing (WPD)
The market is still in uptrend but we got a massive bearish pin bar (PB) on the way. Its size and the lack of sellers in its swing could mean a direct inversion PB. A direct inversion PB is a PB that immediately turns the market trend. But like most advanced patterns, we need to see it confirmed before we know it’s really what it looks like to be. How do those PBs get confirmed? They are meant to quickly create a strong momentum in their direction (bearish in our case) and then a continuation range market (RM). Strong momentum means a strong bearish candle would appear in this month and then we’d see a RM forming where the market takes a breath. Price tends to break that RM later on, and keep going its new direction. That’s why that RM is called “continuation”.
So, are we doomed seeing the ice stock crash? Well, only if the above factors happen. Otherwise in this specific scenario the PB could be just an exhaustion bar. What’s an exhaustion bar? It’s a “fake” price action pattern caused by sellers (in this case) exhausting their force. If this is the case, price will rise again inside the dynamic RM formed by the two diagonal red lines (trend lines, TL) till its resistance.
Anyway the PB closed:
– below the monthly level 678.55
– below the weekly level (shown in the weekly chart) 729.52
– inside the weekly RM (W RM) we talked about in Part 1. This, plus the fact that the PB has yet to reach its first target means that it’d be extremely dangerous to buy now. It might work, but informations are all against it. By the way, I have said that many times in the past, but I want to remind that the “PB first target” is the minimum (or maximum in case of bullish PBs) of the bar before it. Many times when the PB is counter trend – like in this case – that first target could be missed by a 20-30% margin due to too strong adverse momentum.
What other information may we gather? The most experts in price action analysis have probably seen a triangle forming right at the last bars. I leave as exercise to the readers to find out what this means. Hint: it may mean a lot!
