Weekly chart
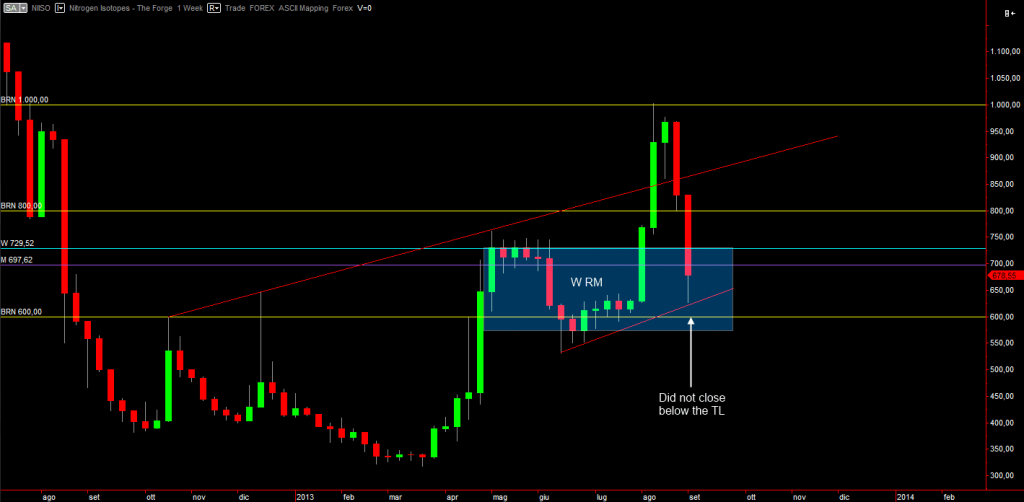
~1~Like in Nitrogen Isotopes market analysis Pt 1, the W chart yields a lot of information. The first information is good for those who are left with stock in their hands: the last bar closed above the red support trend line (TL) and also above BRN 600. However, we are in a downtrend on the weekly chart and price did close inside the blue RM and below both the M and W levels to there’s not really a lot to rejoyce about. As price is squeezed between all these market structures, it tends start ranging and creating “battle bars”, that is dojis and spinning tops.
Needless to say, trading in the middle of the buyers-sellers battle is not healthy to the wallet. If price will dip to BRN 600 and forms a tradable setup then it might be worth the risk, else it’s dangerous to trade anywhere inside the dynamic RM (that is between the two red tren lines ), expecially below the weekly level.
Station traders will rejoyce instead, these battles move and shake the market and help their orders getting filled quicker.
Final advice: we are in a downtrend on the W chart. This conflicts with the M chart and this alone means danger, we are really meant to trade with all three time frames showing the same direction.
Daily chart
Where Price is Going (WPG)
As expected, price is reacting to the confluence between 600 BRN and the lower red trend line, acting as dynamic support.
As said in the W analysis, price is squeezed and thus is ranging between support and resistance. Support is the confluence described above, resistance is the W RM resistance.
