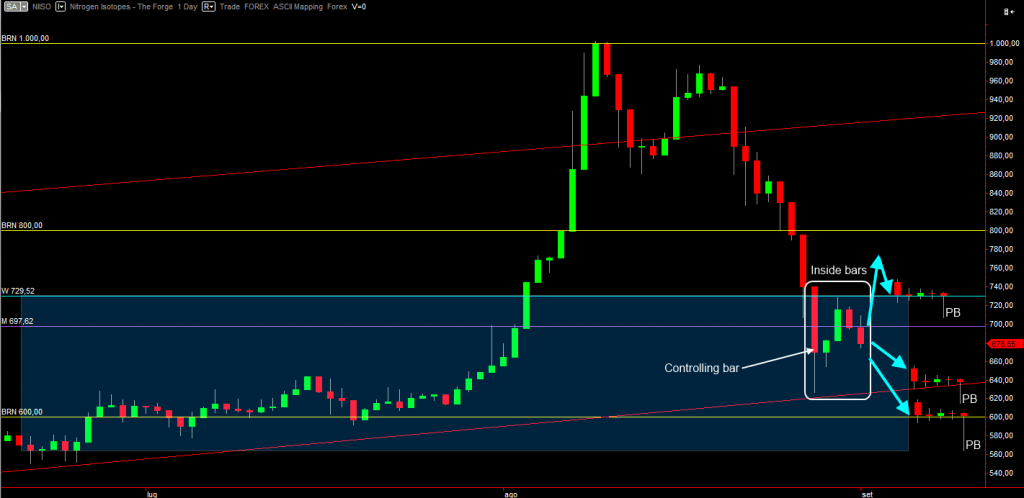
In particular, about a week ago a powerful bar re-entered the W RM (in blue). It has to be powerful because it had to break through the RM upper side which is in confluence with the weekly price level 729.52. This bar created one structure that happens again and again in every market: the controlling bar (CB). What’s a CB? It’s a strong bar that defines a market space, usually a range market. It has many properties, including having a target (it’s low or high, depending on its color) and forcing the next bars to stay inside it. Inside means the next bar(s) minimums and maximums are inside the CB’s ones. When a CB happens on a M or W chart it’s good news, because we can know in advance where price will go and how it’ll behave. On a D chart it’s less useful as EvE does not provide “intraday” bars (yet). In this specific scenario, we see a marked CB encasing the next bars that act as “inside bars” (IBs). Inside bars is an huge topic I can’t cover here, they have a lot of properties and are one of the most complex market structures.
The CB neatly (never randomly) fits between the W RM resistance and the trend line below. The CB and the IBs are the plastic demonstration of the “markets tend to range when squeezed between important levels” said earlier.
~1~
What happens next?
I wish I could say: “buy, buy, buy!” as rising Nitrogen Isotopes price is always in my interest but I am no fortune-teller.
Swing traders seek statistical edges, in order to have such edge we need:
– All the three time frames to be concordant. This means the W chart has to bottom out first.
– When price changes trend, it rarely does it in a sudden way (direct inversion pin bars are very, very rare). Like steering a snake or a train, first the “agile” daily bars start to range and then to slowly invert their direction. The continued new direction reflects on the W bars since they are composed of D bars. Several weeks of inversion will then cause even the slow and sluggish M bars to “steer”. Once established a new trend, it becomes the new, hard to steer direction and this inertia and delay at adapting at the ever changing demand and supply ratio is what swing traders make a living upon. In fact they see a new trend and “jump on the new trend bandwagon” early enough to make a profit before the trend is exhausted and inverts again.
To sum it up, in order to be sure to buy, we have to see the D bars already steering upwards and placing a price action bar(s) at a support level.
I have drawn a tentative chart with a series of bars that could entice a buy. There are three scenarios, none of them is optimal (in real life I would never trade them) because each of them has important levels above them that could slow down or even halt price. The safest scenario would be the bottom one or even a (not drawn) scenario showing those bars forming at the W RM support. The middle is the most dangerous as it’s in the thick of the battle between buyers and sellers.
