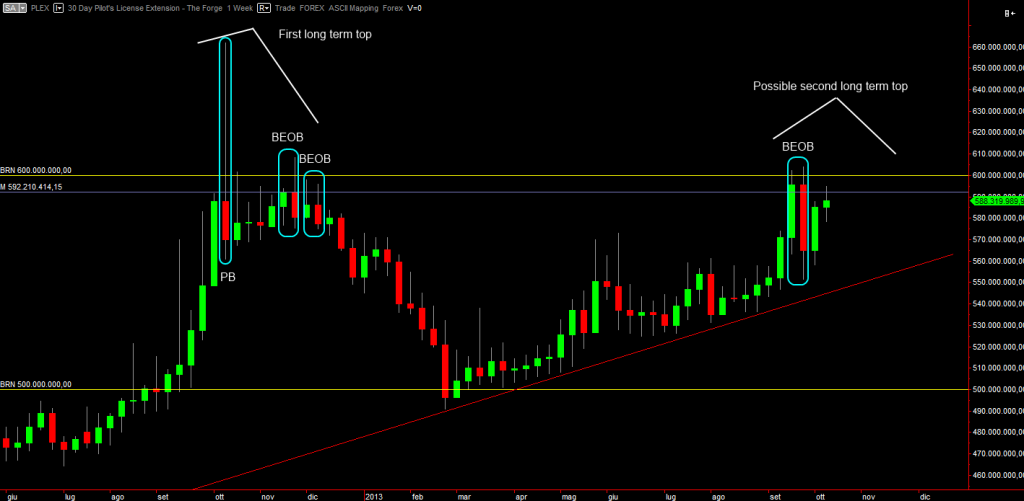
Weekly chart
~1~Price has formed a triple top in 2012 and then went down. Seen on a monthly chart, that triple top becomes one bar. This is the fractal nature of the markets: higher time frame structures including bars are composed by the sum of the lower time frame structures.
Now, price has recently formed a BEOB due to the 600M BRN having acted as resistance. Differently than the first top, this time there’s very little room between the BRN and the trend line below. Therefore something will happen. The diagonal levels like the trend line tend to be weaker than horizontal ones, because traders easily recall (and put orders at) round numbers but don’t know about (almost) non speculative, obscure diagonal levels created by supply and demand. Therefore it’s reasonable to imagine price breaking the trend line.
Anyway as traders we must exclusively look at what price is doing with no pretense to predict future. Therefore WPD for the weekly chart is: “price is ranging”, both between 600M BRN and 500M BRN and between 600M BRN and the trend line.

Daily chart
Where Price is Going (WPG)
Price is ranging in a triangle and is approaching its apex.
At any point, point may break such triangle. When it happens, price “unleashes” like a compressed coil and gains momentum. This is one of the most typical ways (called accumulation) that price employs to gain energy enough to break through resistance / support levels.
If price will break upwards, we may wait for a price action setup standing on top of 600M BRN. The setup would be confirmed by a retracement plus price action bar sitting exactly at 600M. The first target will be 650M, that is the tip of 2012’s price pin bar tail.