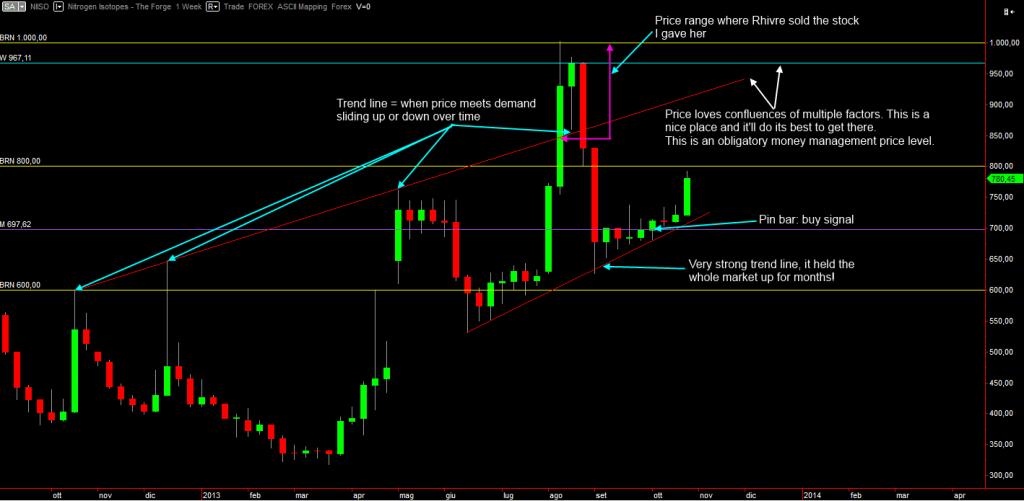
Weekly chart
~1~The weekly chart gives a lot of information. Price is currently being “corraled” within two trend lines (in red) that act as “rails”. That is, WPD = inside an RM, a dynamic RM. Dynamic is this trading method’s term for diagonal market structures.
These are complex structures and they are a great proof that my old belief: “EvE markets behave in a similar way to real life markets” is true. That is, despite the huge majority of EvE players don’t (care to) know anything about trading, analysis and lack of a candlestick capable platform, the structures still form, even complex ones like the trend lines. Not only they form but they work perfectly as well. Look at the very strong lower trend line, it singlehandedly held price above it for 5 months so far.
The cyan arrows show the price points that formed the trend lines.
The weekly pin bar closing above the monthly level (sitting at around RN 700) shows a good time frame to go search in the daily chart for trade signals.
The white arrows to the right of the upper trend line show a spot where price might decide to go in case it closes above BRN 800. It’s an expecially sweet spot because it’s where the upper trend line and the weekly 967.11 price level meet. In trading terms this spot where multiple market structures converge is called “confluence”.
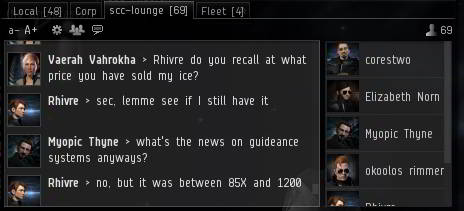
The violet arrows show Rhivre’s sales, happened at the previous swing high. That’s a quite good “buy low, sell high” setup. Here’s her own words about the sales prices range, proving that I don’t just talk about markets, but I really put money where the mouth is:

