Daily chart
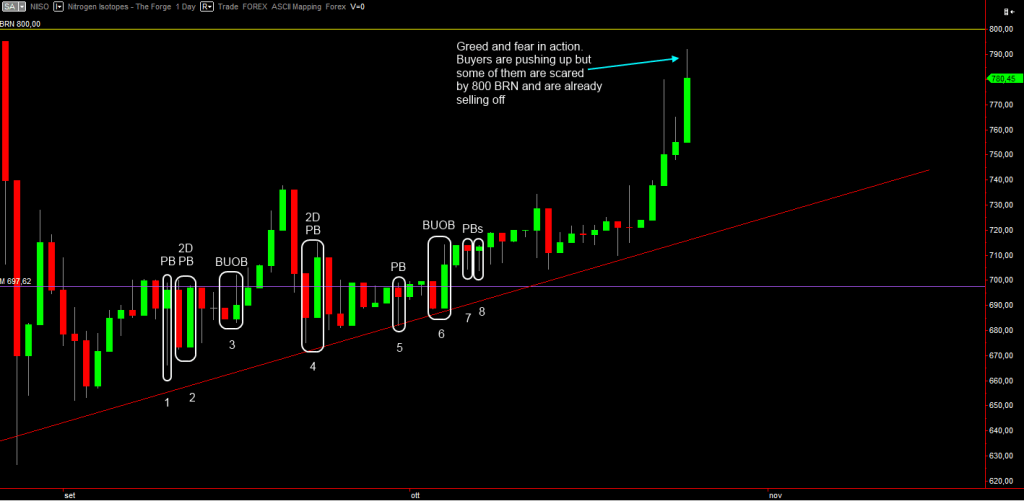
~1~Compared to its weekly counterpart, the daily chart does not show great news. We just have a zoom in of what price has done in the recent past: WPG = going to BRN 800.
What can be seen, instead, is a lot of didactical content, my favourite!
In particular, what we use the daily chart for, is to find trading signals after having identified a “ripe market” in the monthly and weekly charts.
In this case we find a lot of bars, all clustered together. What’s this? The “abundance of bars” is also known as “buyers and sellers battle for a monthly level” and happens a lot in real life markets. Whoever breaks above or below that cluster of bars has won. That cluster is nothing else but a RM half split above and below the level being fought after.
In these situations is quite hard to find a proper price action pattern. Even if there are many, the majority are not viable trading signals. I have drawn rounded rectangles around some of those patterns and will explain why those are or are not viable patterns for a trading signal.
It’s of utmost importance to apply the below listed “selection criteria” because one day I won’t be here to show you the entries.
The only point of these years of blogging and analyses is to get you ready to perform your own analyses and trades.
I have been blessed in my life by having met somebody who taught me this method (for free!) and likewise I want to do with you.
When it will be just you and the market and you won’t have the luxury of looking back at charts describing the past but will have to deal with the unknown, then having strong and tested selection criteria will be what makes the difference.
Knowing WPD and WPG will be a necessary yet not sufficient asset in your arsenal, you must also know how to pick the right bar to trade over the many the market will show you.
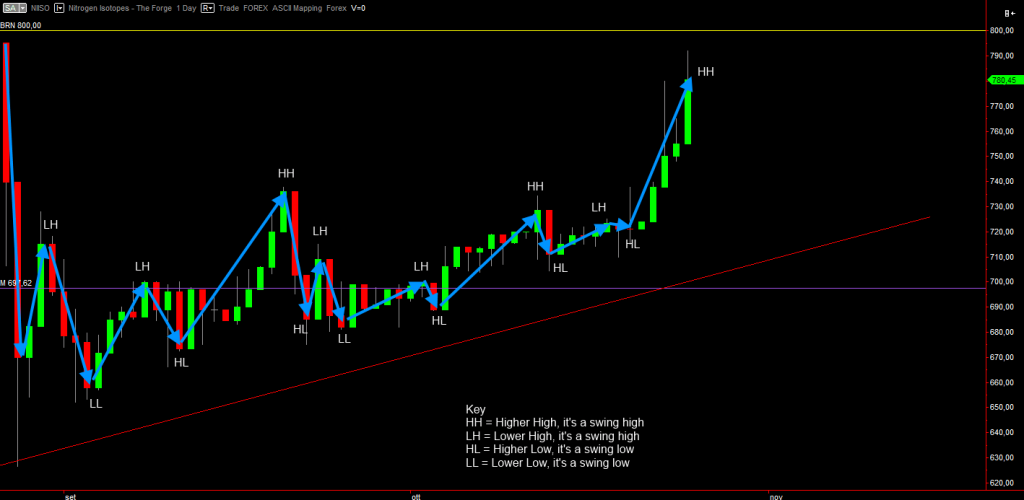
Before I explain you why some entries are so bad, let me show a brief concept about swings, that is the “market’s breath”.
Markets ethernally swing low and high, in an unique zig zag motion.
Here is a special chart of Nitrogen Isotopes where swings have been drawn with arrows. Pay attention at the kind of swings: when price zig zags “down”, it’s called a “swing low”, when price zig zags high, it’s called “swing high”. When comparing a swing high with the previous swing high, one will be “higher high”, the other “lower high” as it sits lower than the other. Likewise, when comparing lows, one will be “higher low” and the other “lower low” as it sits below the other.

