Daily chart
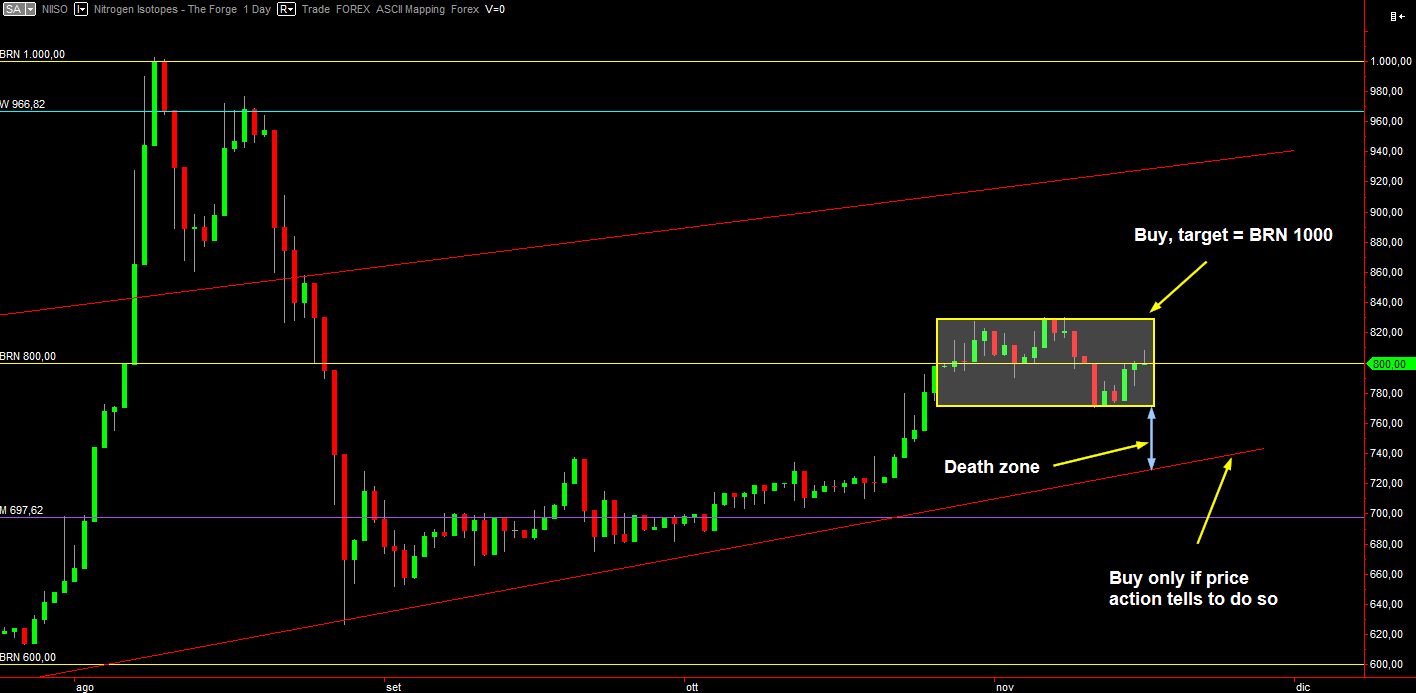
~1~Price is exactly at the middle of the fight zone (800 BRN).
I have drawn three of the possible scenarios.
– Scenario 1: buyers win and drag price outside of the yellow rectangle (it’s the same rectangle I have also drawn on the weekly chart). If so, the next target is the upper red trend line. By the time price gets there, the trend line will cross 1000 ISK BRN and we’ll have a so called confluence. Confluences are powerful situations where multiple factors align up, boosting their effects each other. If buyers win and price gets to 1000, that level will be a good place to either push price sky high or to powerfully repel it down. Above the rectangle it’s advisable to buy, as long as price puts a bullish price action pattern on top of it, Please read my EvE-RL finance thread to learn a lot more about these concepts.
– Scenario 2: sellers win and drag price below the yellow rectangle. It’s a DANGEROUS area, because price will be stuck between the rectangle bottom (aka RM “support”) and the lower red trend line. This will cause a battle where you SHALL risk losing ISK if you’ll buy in there.
– Scenario 3: sellers win and drag price back to the lower trend line. If and only if price will put a bullish price action pattern then you may buy and have a decent hope it’ll go back up again. Just take attention when it goes back to the yellow rectangle because meeting its bottom will create a resistance effect that will try push price back down. So you have to employ money management in there. More about money management is in my finance thread.
If sellers drag price below the lower trend line and put a bearish price action pattern, then it’s going to be a painful day. The day of panic dumping. That trend line is way too strong to not cause mayhem when broken.
