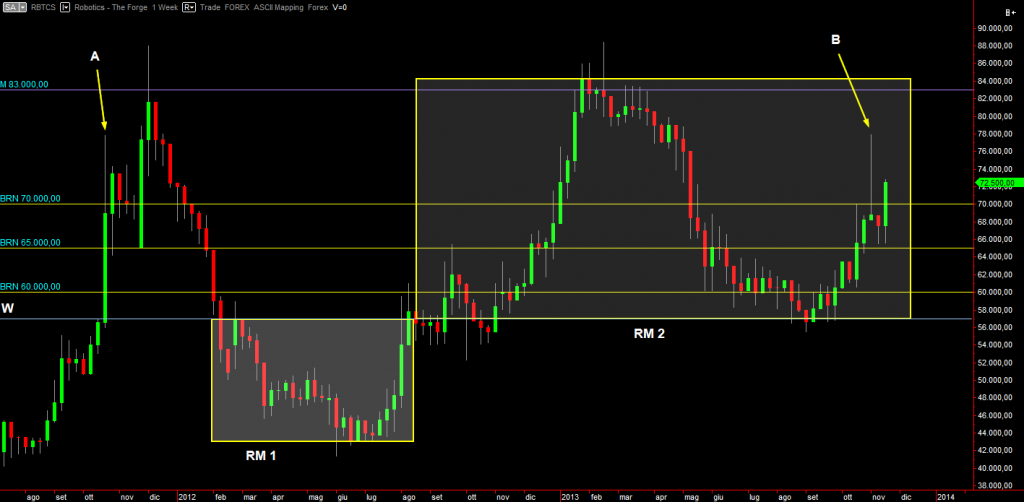
Weekly chart
~1~This chart is more informative. We can see how price in the last two years formed two range markets: RM 1 and RM 2. They are not randomly placed, the top of RM1 acts as bottom of RM2. This configuration is called “Market Dynamic Type 1”, in contrast with Type 2 which consists of a RM closing at the median price of another.
Moreover, please note the incredible price precision at showing its “memory effect”. Point B price behaved and got to the same price point A did: Round Number 78,000 ISK. What happens of so important at A / B price level? We don’t know, some fundamental analysis guru might. But we don’t know and… don’t care! We are only looking to the fact that something important happens at 78,000 and this means caution has to be exercised around there.
This suggests buying as of now is imprudent. The pattern formed by the last two weekly bars (the two after “B”) forms a DBLHC, that is a bullish pattern. But it’s so late in the trend that you risk buying close to a price top.
A much more prudent setup would be to wait for price to get soon back to 70,000 BRN and retrace. That would give price new liquidity and also a chance to break the strong “B” bearish pin bar. If price won’t do it, it will be weak and will be harder to break it.
