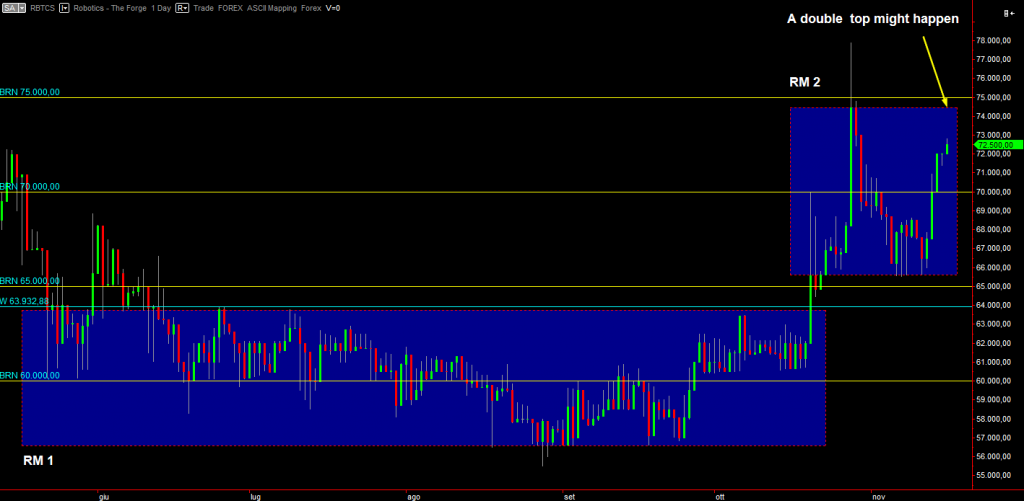
Daily chart
~1~Price is trying to go hit the RM 2 resistance, in confluence with 75,000 BRN. If this will happen, the strong bearish pin bar (next to the RM 2 label) delimiting the RM 2 top will affect the price run upwards. There’s a risk of a double top forming, this would impose a careful money management of open positions close to 75,000. If price closes above the RM 2 then this precaution is not needed.
If price breaks above RM 2, instead, the first target is the high (the tail tip) of the bearish pin bar. The second is the purple monthly level at 83,000 RN. The last target is set at 87,000 RN, that is the history high.
A curiosity about his chart: there’s a vast fighting blue zone (RM 1) around 60,000 BRN. That’s the current bottom for minor price motions. This is the fair price that this market expressed in the last 5 months. Determining these fair prices is important. To give an example, this amount is what I would calculate collateral value on, in case somebody asked me a loan using Robotics as collateral. Because it’s a solid and lasting reference.
In closing, at the moment it’s too late to safely buy. If price retraces down to BRN 70,000 and puts up a bullish entry, it might be worth a try but we’d still be buying fairly higher than the “fair value” located at the RM 1 below and thus risk would still be there.
If already in the market, take an hard look at what happens in the days price will hit BRN 75,000 again (if it happens that is!) because there’s a chance it’ll setup the second top, forming a double top and thus setting up a possible bearish inversion.
