Add indicators to the chart
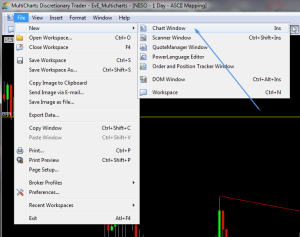
~1~You may choose to drop the indicators on your current chart or create a new chart on the same commodity and drop the indicators on it.
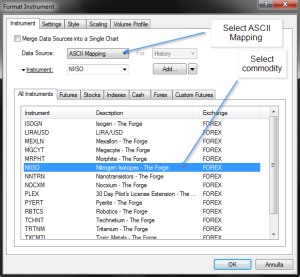
A selection window will open, asking for which commodity to use in the new chart. It’s important to select “ASCII Mapping” so you can see the EvE Online commodities. In fact the previous tutorials show how to import the data by using the ASCII import functionality.
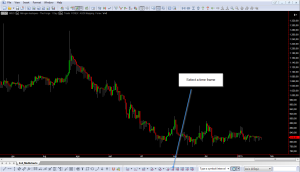
An empty chart will show up. Make sure to see enough bars. One way to do that, is to click on the “D” button to switch to daily bars. Feel free to play with the nearby buttons to see how the chart changes depending on time frame.
Adding indicators
It’s finally time to add indicators! In this tutorials I’ll go for a very standard setup: Bollinger Bands, RSI and MACD.
Bollinger Bands are an “overlay” indicator: it appears on top of the price bars.
The others are “panel” indicators: they appear at the bottom of the chart and show their own diagrams.
Adding Bollinger Bands
In order to add the Bollinger Bands or any other indicator, go to the Insert menu, then Study.
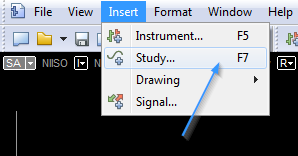
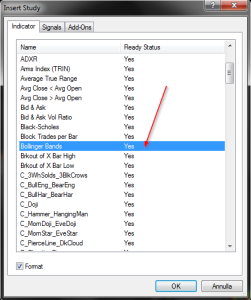
A popup window will appear, where it’s possible to select one of many available indicators:
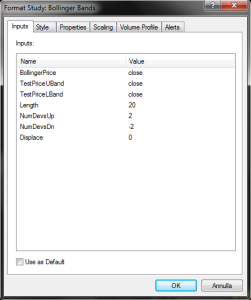
Most indicators come with their own set of options and settings. This is the Bollinger Bands settings window:
