Introduction 
This is an example of a trade taken in EvE® Online with criteria and software covered by the Price Action Trading Course published on this web site.
Both the various software setup and market analysis may look daunting at first. The effort is indeed required but only the first times. After that, the whole chain of procedures takes about 5 minutes, the market analysis takes 15-20 minutes. This is less time intensive than analyzing an EvE® trading route or finding out which items are to sell and which to reprocess.
This whole article is the complete “brain dump” of what would push a Price Action trader to open a trade. It’s quite long but I wanted to miss no detail and no step, to make it as understandable as possible.
~1~
Prices history has been exported from EvE Marketeer by following the procedure shown on this web site, at this location.
The resulting OHLC text file has subsequently been imported in the MultiCharts® Discretionary Trader charting software, by following the procedure shown on this web site, at this location.
Why the trade happened and market analysis
During the last years in EvE® Online, a player called Helicity Boson organized a “special event” called Hulkageddon. Around the end of each year, Helicity would create a forum thread detailing the ruleset and prizes for the next event, to be held in February. This year was no exception, the Hulkageddon V thread has been posted.
Hulkageddon causes ships destructions and minerals / ice isotopes shortage. This a nice earning opportunity for a series of players: industrial ships builders, suicide gank boats manufacturers, modules builders, miners and traders / speculators. Being a trader with a certain insight into the Nitrogen Isotopes market I kept tabs both on the Hulkageddon thread and the market.
The market had dropped a lot during the past months but I could not search for profit opportunities, since I was not subscribed to EvE® Online.
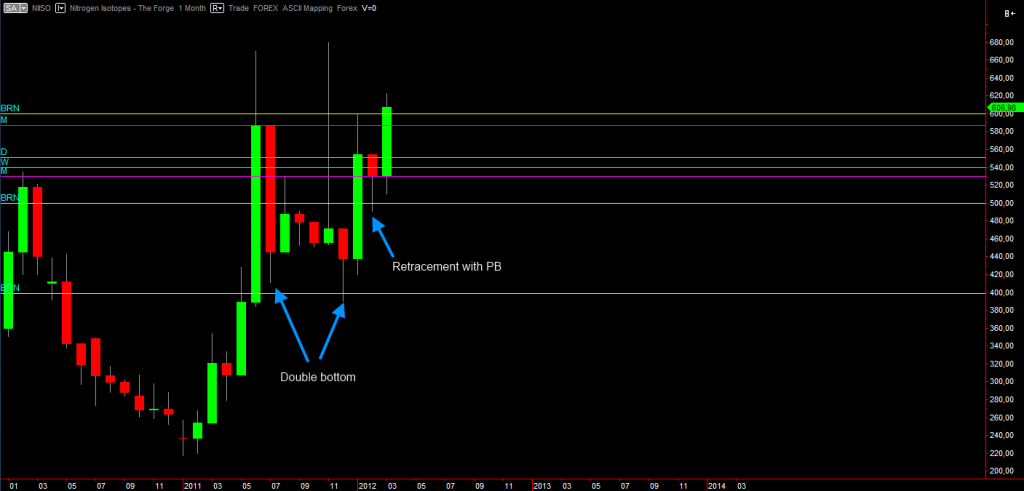
When I resubscribed (around December 20, 2011), Nitrogen Isotopes were already up to the resistance level of a continuity double bottom.
All I could do was to wait. Price hit exactly Big Round Number (BRN) 600 and like a real life market, a cascade of sell orders triggered. As we call it in real life trading, “sellers took liquidity from the BRN 600 resistance”. The candle shadow (upper December 2011 candle “wick”) is exactly the graphical representation of the massive sellers reaction that happened the instant price (P) hit 600. In January P continued to drop. Later it’d form a monthly pin bar (PB) but I could not know about it back at middle of January 2012, when the same bar looked like a full bearish bar.
Now, at mid January, on one side I knew that the long term trend was going up and What Price is Doing (WPD) was Range Market (RM) with upwards bias (at least until a double top would form), on another I knew that Hulkageddon would start possibly 2 weeks later and prices would rise.
