 Consulting
Performance audit report about Rykker Bow’s bond
This is Vaerah Vahrokha’s analysis as of 2012-06-06 22:00 EvE Time.
NEISIN code: CSRYKKEBO077 / CSRB7TSBO077.
Official discussion: link to investment prospectus.
Public Audits Record (PAR) for this investment: backlink.
Tools used
jEveAssets
EvE Income Analyzer Vahrokh.com Edition
EvE Wallet Aware
EvE Mentat
Microsoft® Excel™
Blender 3D => LuxRender
Paint.NET => Bolt Bait Pack, DPY Plugins, MadJik Pack, Vandermotten Effects
Forewords about the Audit
Rykker Bow is an high volume sec trader.
He contacted the Auditor to get a performance audit prepared.
This audit will cover the trading activities past performance and his NAV.
Important! This analysis covers only a period from May 29 to June 06, 2012. Older records from May 24 have been included as well but due to the massive transactions volume it’s not guaranteed to cover from the bond beginning.
Involvement in other business
None.
Net Asset Value and other balance considerations
Beginning of the analysis period
The estimated net worth of all liabilities, solid & liquid assets is about 35.020B ISK.
Market transactions are made by the Investee character.
Assets across all of the characters and corporations are estimated to be worth 17.367B ISK.
Important notice: the reported values may be lower than the real amounts, because certain assets in certain conditions are not reported by the API.
Liabilities include the Investors principal plus unrealized interest.
Assets and balance
1">audit-record" border="0">| 1">audit-record" style="text-align: left;" colspan="3">Balance | ||
|---|---|---|
| Wallet balance: | 14.965 | B |
| Market sell-orders: | 10.419 | B |
| Market escrow: | 8.019 | B |
| Contracts: | 0.000 | B |
| Investments / receivable: | 0.000 | B |
| Liabilities / payable: | (15.750) | B |
| Total: | 17.653 | B |
1">audit-record" style="width: 493px; height: 400px;" border="0">
| 1">audit-record" style="text-align: left;" colspan="3">Assets | ||
|---|---|---|
| POS: | 0.000 | B |
| Fleet / ships (unfitted): | 4.575 | B |
| Modules: | 6.437 | B |
| Misc. solid assets; minerals, salvage, ice and trade goods etc.: | 1.004 | B |
| Blueprint copies and originals: | 3.072 | B |
Other | ||
| Accessories (includes PLEXes): | 0.480 | B |
| Charges: | 0.019 | B |
| Commodities: | 0.120 | B |
| Drones: | 0.004 | B |
| Ordered assets under construction: | 0.000 | B |
| Planetary items or resources: | 0.000 | B |
| Ship components: | 0.000 | B |
| General or classified items: | 1.656 | B |
| Total: | 17.367 | B |
Estimated grand total: 35.020 Billion ISK
Net Asset Value and other balance considerations
End of the analysis period (today)
The estimated net worth of all liabilities, solid & liquid assets is about 55.082B ISK.
Market transactions are made by the Investee character.
Assets across all of the characters and corporations are estimated to be worth 23.019B.
Important notice: the reported values may be lower than the real amounts, because certain assets in certain conditions are not reported by the API.
Assets and balance
1">audit-record" border="0">| 1">audit-record" style="text-align: left;" colspan="3">Balance | ||
|---|---|---|
| Wallet balance: | 21.487 | B |
| Market sell-orders: | 18.943 | B |
| Market escrow: | 7.383 | B |
| Contracts: | 0.000 | B |
| Investments / receivable: | 0.000 | B |
| Liabilities / payable: | (15.750) | B |
| Total: | 32.063 | B |
1">audit-record" style="width: 493px; height: 400px;" border="0">
| 1">audit-record" style="text-align: left;" colspan="3">Assets | ||
|---|---|---|
| POS: | 0.000 | B |
| Fleet / ships (unfitted): | 4.799 | B |
| Modules: | 8.274 | B |
| Misc. solid assets; minerals, salvage, ice and trade goods etc.: | 0.737 | B |
| Blueprint copies and originals: | 3.159 | B |
Other | ||
| Accessories (includes PLEXes): | 2.901 | B |
| Charges: | 0.018 | B |
| Commodities: | 0.149 | B |
| Drones: | 0.004 | B |
| Ordered assets under construction: | 0.000 | B |
| Planetary items or resources: | 0.000 | B |
| Ship components: | 0.000 | B |
| General or classified items: | 2.978 | B |
| Total: | 23.019 | B |
Estimated grand total: 55.082 Billion ISK
The above evaluations were made by using The Forge prices as reference.
Comparison with the previous audit reported NAV
1">audit-wallets" style="width: 493px;" border="0">| Wallet | ||
|---|---|---|
| Previous | 17.653 | B |
| Current | 32.063 | B |
| Difference | 14.410 | B |
| Change | 181 | % |
1">audit-assets" style="width: 493px;" border="0">
| Assets | ||
|---|---|---|
| Previous | 17.367 | B |
| Current | 23.019 | B |
| Difference | 5.652 | B |
| Change | 132 | % |
1">audit-navs" style="width: 493px;" border="0">
| NAV | ||
|---|---|---|
| Previous | 35.020 | B |
| Current | 55.082 | B |
| Difference | 20.062 | B |
| Change | 157 | % |
Markets performance analysis
Due to the changes in the EvE® API, most of the analysis softwares used in the past seem to work any longer. In order to improve this audit’s presentation, the Auditor ported and bug fixed one of them to the new standard. Thus EvE Income Analyzer Vahrokh.com Edition was born.
Important! This analysis covers only a period from May 29 to June 06, 2012. Older records from May 24 have been included as well but due to the massive transactions volume it’s not guaranteed to cover from the bond beginning.
Forewords
Rykker Bow is known as an high volume trader. Since this bond he partly changed his strategy to include a wider items basket. This has proved to be a very profitable change. The turnover is massive, the profits above the average.
Statistics
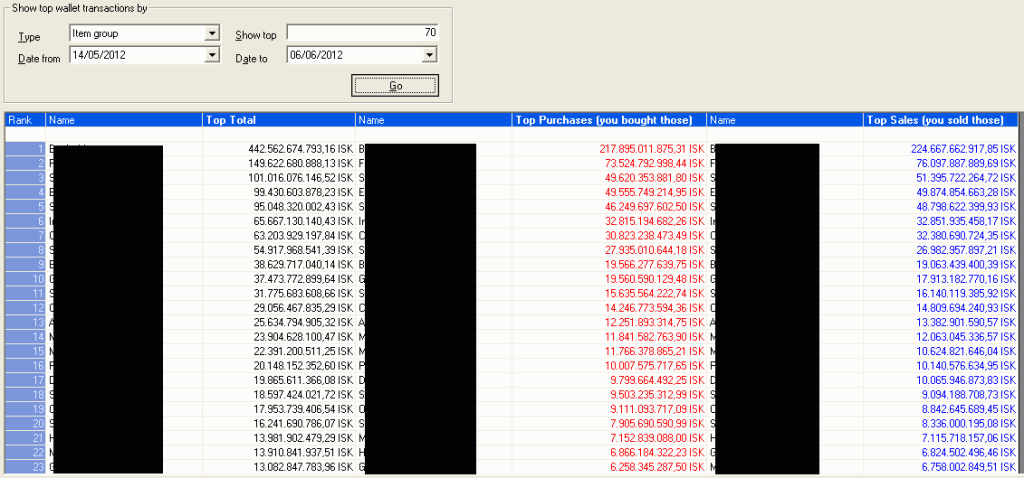
Rykker Bow has traded so many items that they had to be put in 69 different groups.
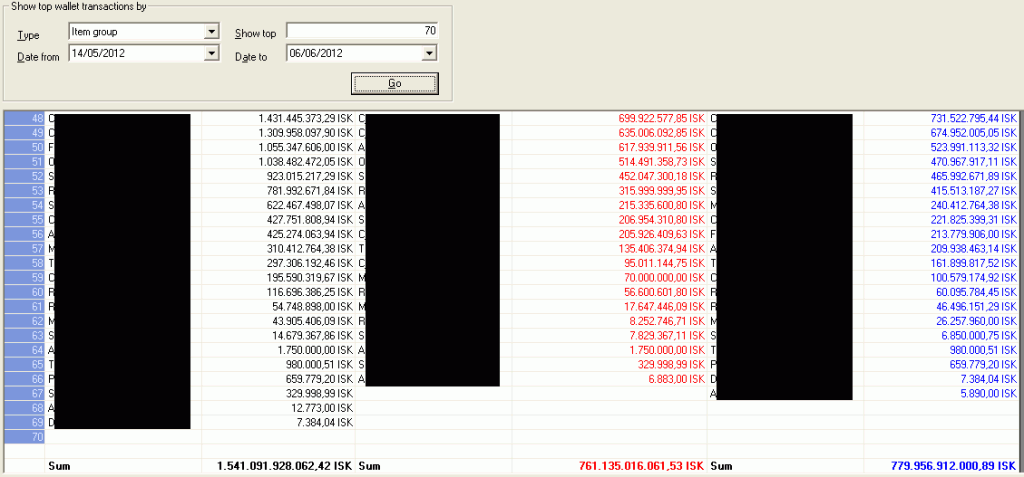
His turnover has been of 1.541 Trillions.
His average profit has been of 10.44% per trade.
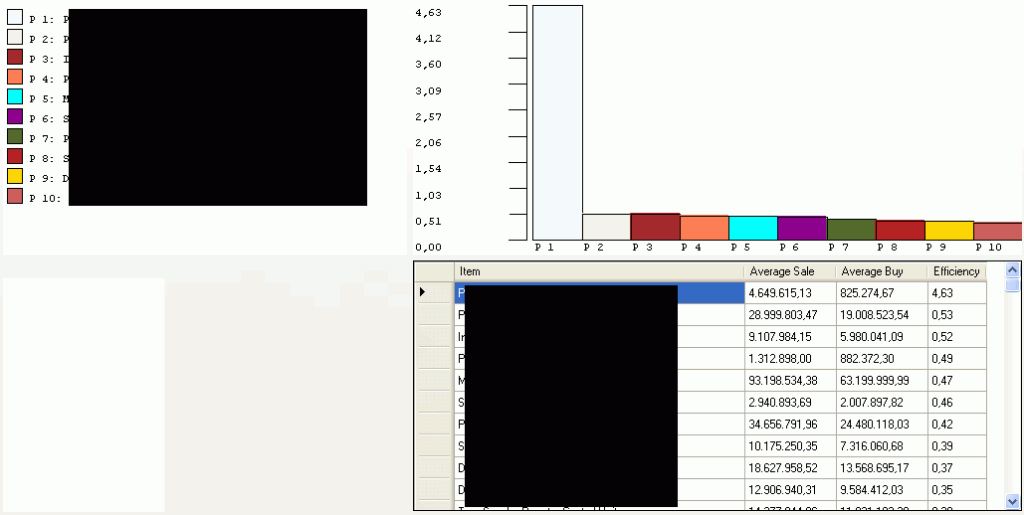
His top 5 most profitable items had a profit from 47% up to 463%.
No item in the top 20 earned less than 22% profit.
Wallet transactions
The following sheets show some of the top and last transaction amounts, including the totals. As mentioned above the items have been grouped so each of the rows is a category of items. The item names have been hidden on Investee request.
Bottom compounded transactions and totals:
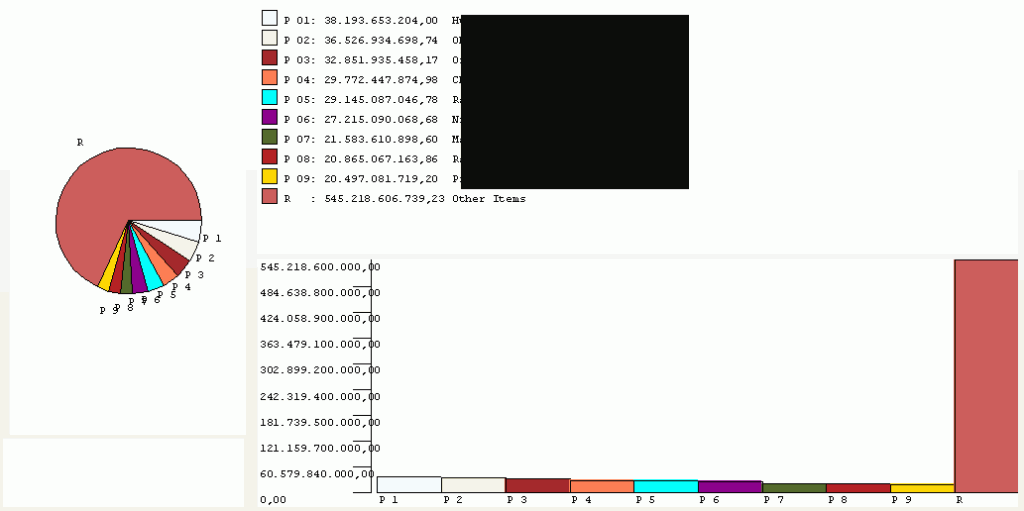
Best selling items
The following graph shows which items were the best selling for the full API covered period. The Investee asked to have the item names blanked.
Trading efficiency
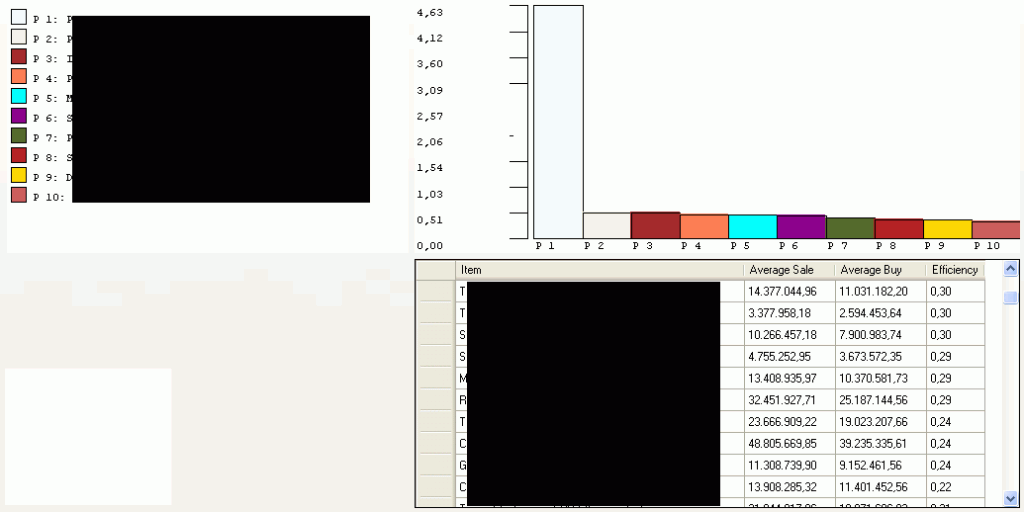
The following graphs show how much margin the Investee made by selling his stock. The “Efficiency” column shows the margin. In example, 0.53 means a 53% margin was achieved. The Investee asked to have the item names blanked. The first graph shows the efficiency of the top 10 items.
The second graph shows the efficiency for the 10th to 20th most efficient items:
Selling speed
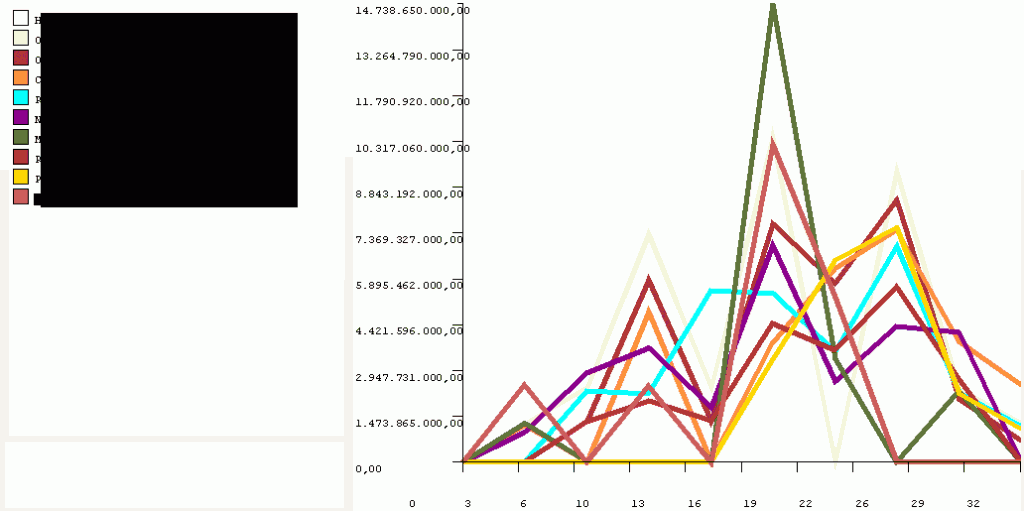
The following graph shows how quickly the stock moved. The Investee asked to have the item names blanked.
Items and markets
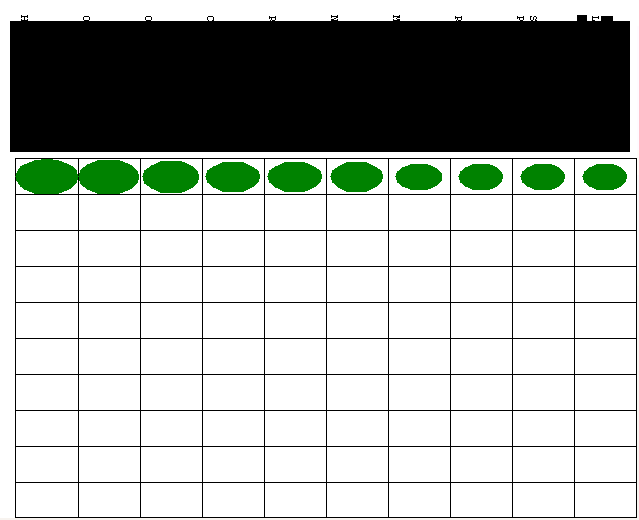
The following graph shows which markets had the highest turnover for which item. The Investee asked to have the item and station names blanked.
Time distribution
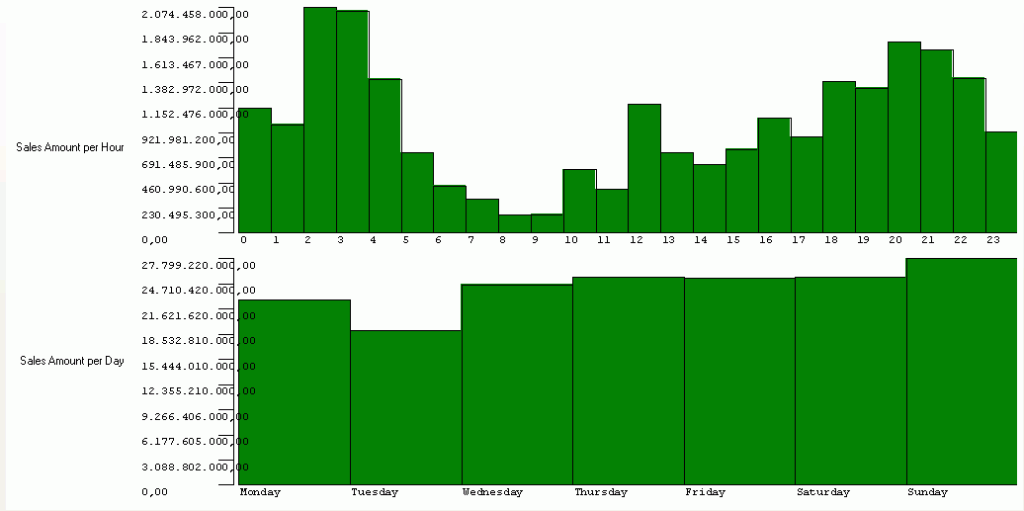
The following chart shows the time distribution (per hour and per day) of the sales.
Disclaimers
Due to stringent EvE API limitations, although the information provided to you on this document is obtained or compiled from sources believed to be reliable, Vahrokh Consulting cannot and does not guarantee the accuracy, validity, timeliness, or completeness of any information or data made available to you for any particular purpose.
This Auditor is actively and passionately against any breach of privacy, in particular regarding in game mail API access. Therefore no information will ever be gathered and no audit will ever be released that will contain any element found by eavesdropping someone else’s private communications.
Neither the information nor any opinion contained in this document constitutes a solicitation or offer by Vahrokh Consulting or its affiliates to buy or sell any securities, assets or services.
