Nitrogen Isotopes market analysis
~1~Lately I have been contacted or EvE-mailed by some players, about what the Nitrogen Isotopes market is doing.
Some of them did that out of pure curiosity, some of them because they know I am into markets analysis and expecially into the Nitrogen Isotopes market. Some of them, finally, because they are personally invested at varying degrees of success.
This analysis will be atypical. I had prepared the material in August 24, to be posted on 25. Yet I had both real life and website technical issues so I had to delay the posting.
Despite being a bit outdated, I will post the original charts at first. Because:
- they costed me some time to prepare and don’t want the effort to go to waste.
- I want you to see the scenarios available 3 (almost 4) days ago and how they evolved.
 But first of all, I’ll post one of the many EvE-mails I send as reply to the players who ask me about the markets. I feel like I am not violating the player’s privacy as I have removed his name and the text is entirely my own reply with no quotes from his text.
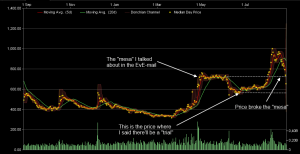
The EvE-mail shows how I was talking him about a realistic scenario days ahead. Follows an EvE chart showing what price indeed did: it broke through the “mesa” and is going to retest the base of that mesa. I used “mesa” in the EvE-mail because that player does not know the finance jargon (here is an acronyms page) and so I could not mention it as being a “RM” (range market). The upper part and lower parts of the RM are nothing else but the RM’s resistance and support levels. The EvE chart shows arrows indicating the various bits I talked about in the EvE-mail.
Here’s the chart updated to today:
Where did I take those ideas about “mesa” and similar? Simple, from the market analysis I was due to post.
Follows the original market analysis, which is a bit outdated but still relevant and, most of all, shows the evolution of the market through its own targets and levels.
Monthly chart
What Price is Doing (WPD)
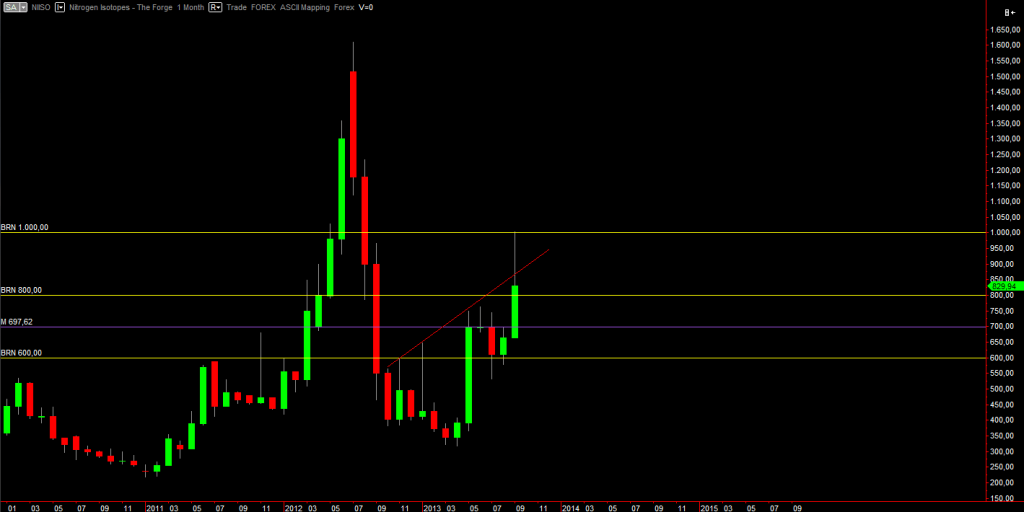
Long term price is in an uptrend, started with the March 2013 BUOB but never officially confirmed by a price action pattern. There is an IB (inside bar) at July 2013 but those usually only give informations, not confirmations.
We may draw a red trend line and find a dynamic resistance price will have to fight to try and break through. Notice the “try” specifier.
The yellow lines, as usual, represent the Big Round Numbers (BRNs) relevant to this market.
The purple line is a monthly level. Now, notice how it nicely matches the last swing but also how it acts as resistance and support to 2011 and 2012 bars. Reading the price at that level once again reveals how traders collectively and inconsciously tend to use round numbers. In fact the level sits at 697.62 ISK, which means that the sum of thousands of trades ended up producing a level 2.38 ISK away from 700 RN. This proves that levels are not a fabrication, but real “points of interest” for market participants. Market participants who love to think in round, decimal numbers.

