PLEX market analysis
~1~Every time the PLEX market does any kind of motion, we see a number of threads dedicated to finding out the secret reasons of that, the big hands that manipulate the markets from obscure command rooms and so on.
Those who follow price action analysis know better than that. The today’s chart is basically an extension of the one shown in this 2012 article.
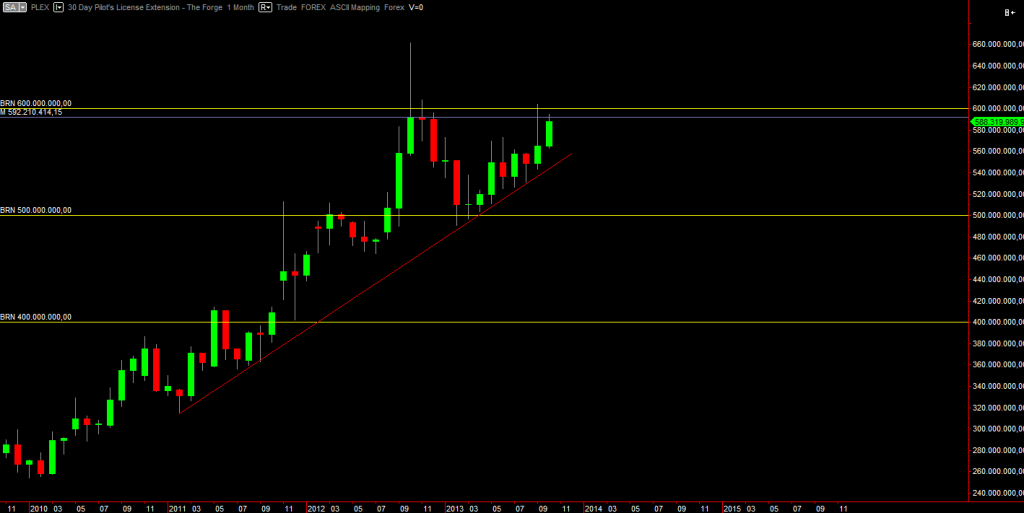
Monthly chart
What Price is Doing (WPD)
The market is still in uptrend. It’s still above the very strong trend line (in red). It has hit a previous top, in confluence with 600M BRN. Unsurprisingly enough, that top happened at October 2012. Notice how that month is exactly the same. The next days will be great days to secure a profit for a large portion of the stock. The remaining part may be left in the market to try and “let the profits run”.

A didactical look at this chart
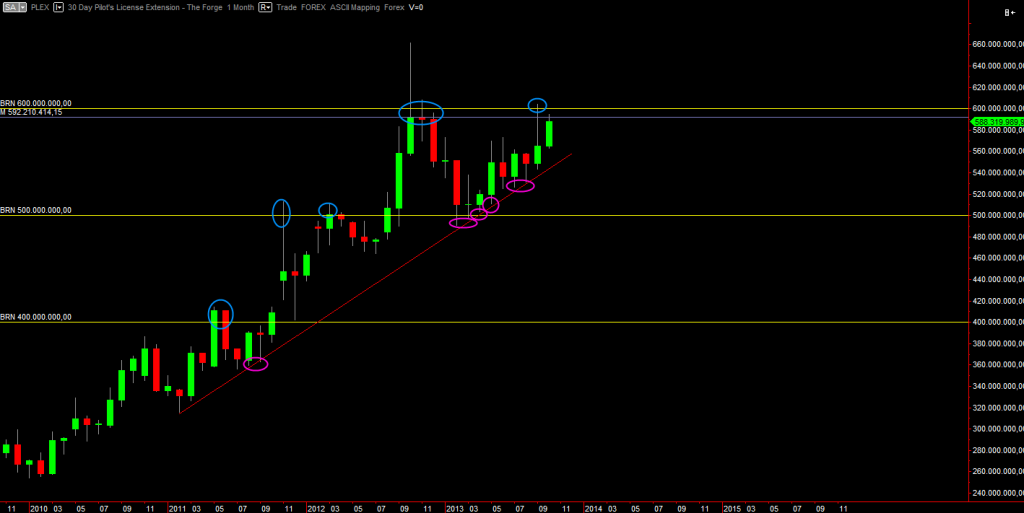
This is the same chart but with an highlight on two important concepts: support and resistance levels strength, support and resistance levels “magnetism”.
- Strength: it’s quite evident how price levels “compress” and constrain price above or below them. Even diagonal levels like the trend line (see purple circles) tend to affect price. Price has to spend its propellant, called liquidity to try and break those levels. When it succeeds, it tends to “take a nap” right above or below those levels, forming a range market. Some rarer times, the traders battle to win a level is so fierce that price starts ranging across the level, causing a level weakening effect over time. Once the level has been “consumed”, price is free to do whatever it wants like that level does not exist.
- Magnetism: levels don’t just compress price. They also attract it when it passes close by. Basically price “snaps” to levels. Look at the blue circles: price deforms its swings or creates long tailed bars just to go hit those levels. Why? Because liquidity sits exactly there, at those levels. Price craves to get more liquidity, it’s the fuel it needs to go on. What’s liquidity? Simple: it’s the market participants money! They create a lot of orders at certain price levels for the most varied reasons. Price action analysts don’t care about what those reasons are about, just about the effects. Orders opposite of price’s trend will create a wall (resistance or support), while orders in favour will create speed ups.
The markets dynamic is this: price runs like a pinball between traders orders walls and “speed coils”. Those walls tend to happen in easy to type or recall spots (big round numbers), other times they happen at known supply and demand equilibrium levels. Price action trading is about finding those levels, looking at where price is going with respect to those levels and then joining the prevalent trend and traders.
